


countly-server
Countly is a privacy-first, AI-powered analytics and engagement platform for understanding and optimizing customer journeys across digital applications, from de
Sign in to rate this tool.
Overview
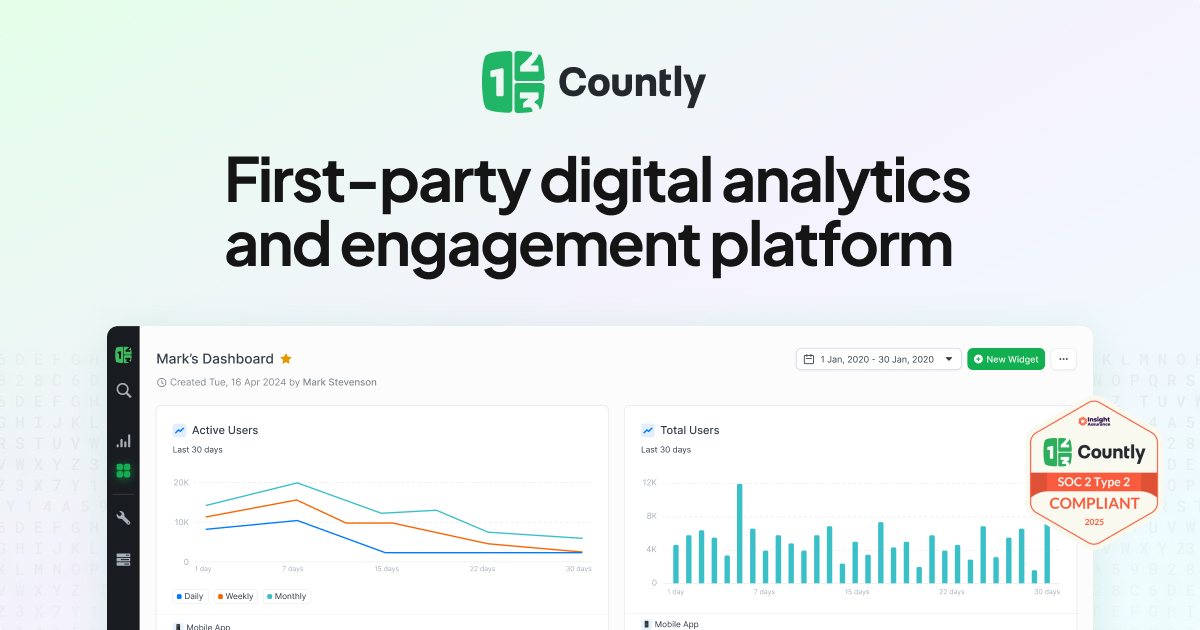
Countly lets you build an analytics stack that stays inside your own data center or private cloud. The service is built around keeping every event first‑party, so you never rely on third‑party cookies or trackers. It works with any language or platform that can send HTTP requests to its SDKs.
Developers can choose from 10 battle‑tested SDKs that cover iOS, Android, Web, Desktop, and even embedded devices. Each SDK records user events, page views, or custom actions and posts them to Countly via a simple RESTful endpoint. The API also accepts raw JSON events, so you can push data from server logs or custom microservices. Once an event arrives, the platform offers a data‑management layer where you define validation rules, set custom attributes, and apply transforms before the event lands in reporting tables. This step ensures that duplicate or malformed data is filtered out, and that the data model stays consistent across channels.
The analytics layer gives product teams three modes of exploration. First‑party dashboards show key metrics like daily active users, session length, and funnel completions, all rendered as time‑series charts or bar graphs. Advanced analysts can use the query builder to slice data by device, geographic region, or custom tags, and then export the results as CSV or embed them in external BI tools via a secure API. AI‑powered tools can automatically propose new dashboards, read headlines from contexts, or suggest attribute filters, reducing the time needed to surface actionable insights. For marketing or support teams, the platform can trigger in‑app messages or push notifications based on real‑time thresholds, such as a user dropping below a certain engagement score. Smart Variables let you alter UI elements for a particular cohort or traffic source without a new app build.
Customer‑journey features let you design multi‑step flows that react to user actions. You can add surveys triggered after a signup flow, or adapt a feature flag in real time using external data. The system also supports A/B testing of different UI flows or messaging variants, collecting click‑through or conversion metrics automatically. All these engagements are still captured as first‑party data, and you can view them side‑by‑side with core application metrics in the same dashboard.
Details
- Pricing
- Free
- Category
- Analytics
Suggest an edit
Sign in to suggest an edit.
Pros and cons
Pros
- First‑party data collection requires no third‑party reliance
- Extensive SDK and API coverage for all major platforms
- AI assistance reduces manual dashboard creation
- Flexible hosting options support strict compliance
Cons
- No pricing information disclosed publicly
- Limited detail on concurrency limits or scalability metrics
- User‑interface descriptions focus on analytics, not configuration options
- No explicit mention of real‑time data streaming capabilities
Alternatives
 Querio 1 0Querio is an AI data analytics platform built around the idea of analytics as code.
 Ad Personam Self Serve Dspad:personam is a self-serve programmatic advertising platform, also called a demand-side platform or DSP.
 AnywordAnyword is an AI content platform for marketing teams that focuses on performance.
 Trumpettrumpet enhances buyer journeys with personalized microsites and analytics to drive revenue.
 ZegashopAI-powered ecommerce website builder with built-in growth strategy and SEO optimization.
 Clipto ComAI-powered media management assistant with transcription, video editing, and asset management tools.
 LovableLovable builds and hosts full web apps from a chat, with Cloud hosting, auth and payments included and a credit-based Pro and Business plan.
 Mple AImple AI is an enterprise platform that aims to guide sales teams in what to do, what to say and how to win each day.
 PostizPostiz is a social media scheduling platform built around AI agents.
 HubtypeHubtype is a platform for designing, launching and managing AI agents on WhatsApp and other business messaging channels.
 Gowit Retail Media Ads PlatformGoWit is a commerce and retail media advertising platform.
 Faraday AIFaraday is a customer context platform for AI agents and marketing workflows.