


Sign in to rate this tool.
Overview
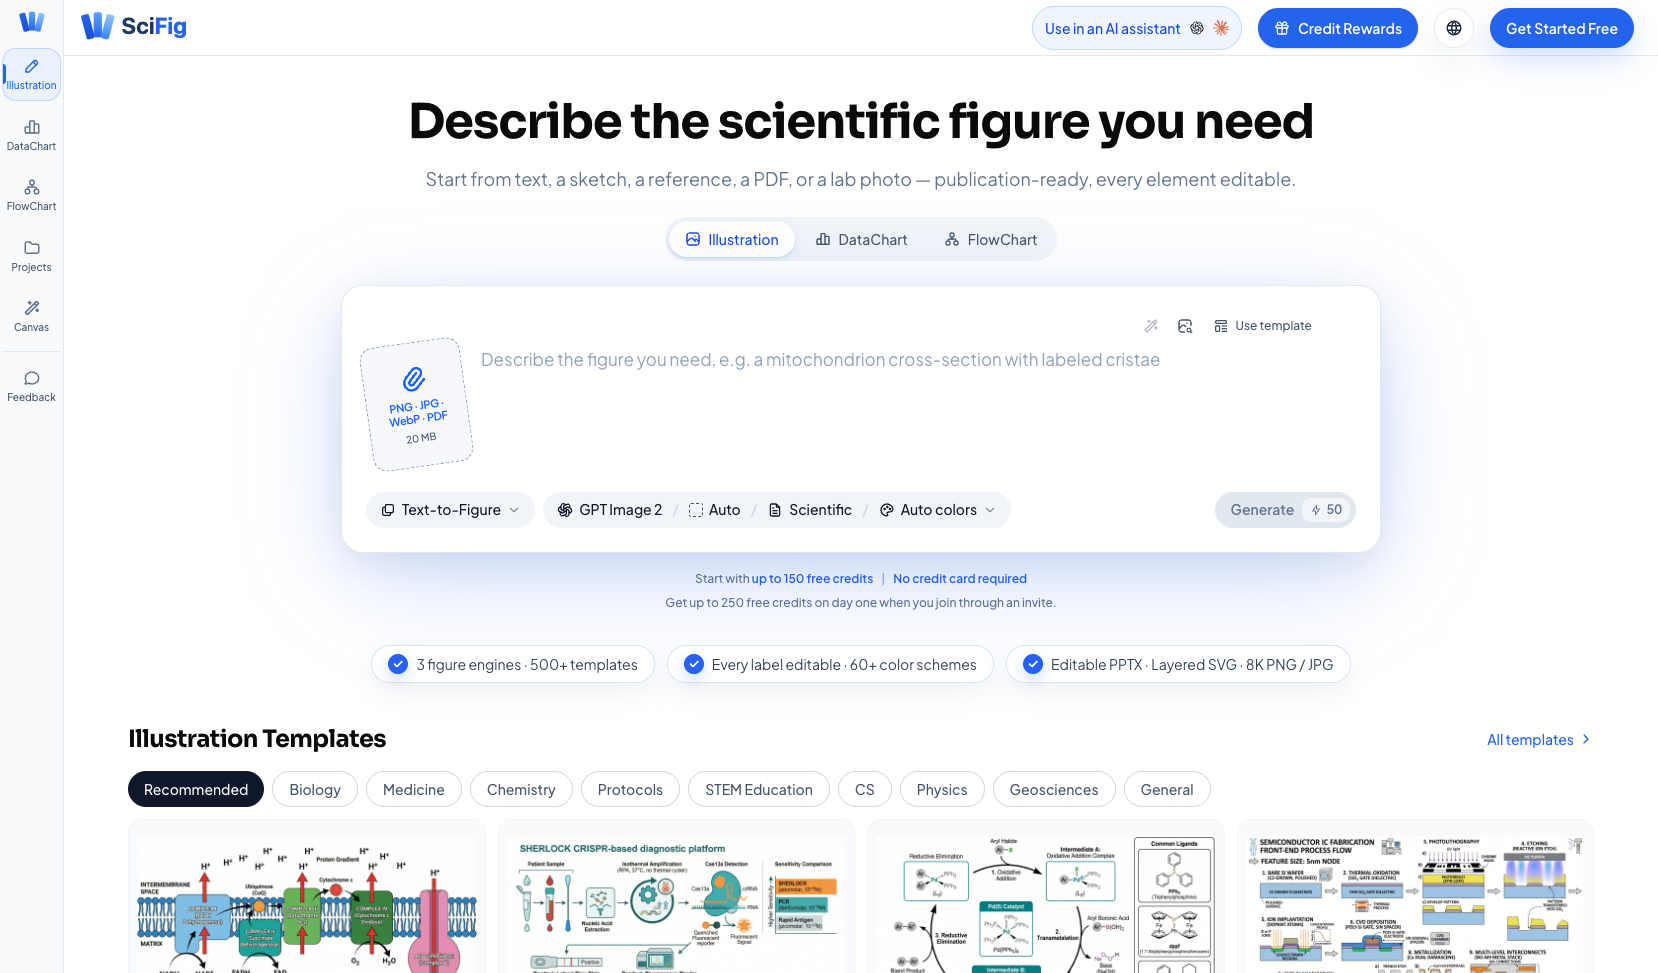
SciFig is a browser‑based visual workspace that helps scientists create scientific illustrations, charts and flow diagrams with AI assistance. You can start from a short text description, a sketch, a photo, a PDF or a data file, and the tool will generate a figure that you can edit before exporting.
The platform offers three separate engines: Illustration, DataChart and FlowChart. The Illustration engine turns sentences, hand‑drawn sketches, lab photos or reference PDFs into editable SVG or PPTX diagrams such as mechanisms, pathways or graphical abstracts. The DataChart engine accepts CSV or Excel files; you describe the desired chart and SciFig produces one of more than 50 chart types, including volcano plots, survival curves and heatmaps, styled with journal‑ready palettes and color‑blind‑safe schemes. The FlowChart engine creates PRISMA, CONSORT or custom protocol diagrams from plain‑language steps, outputting layered SVG, PNG, JPG or editable PowerPoint files.
To use the tool, you open the appropriate app (illustration, datachart or flowchart) and provide an input: a text prompt, an image file (PNG, JPG, WebP, PDF up to 20 MB) or a data table. The AI processes the input in about 30 seconds and presents a draft figure. Every label, color and layer is editable, and you can switch among more than 60 color schemes or 500+ templates covering 11 scientific disciplines. Export options include 8K PNG/JPG, layered SVG and PPTX, allowing direct insertion into manuscripts or presentation decks.
SciFig also includes a credit system that gives new users up to 150 free credits and up to 250 credits on the first day when joining via an invite. Credits never expire, and the site mentions promotional discounts of up to 52 % for paid plans, though specific pricing details are not listed.
Key features
- Three AI engines for illustrations, data‑driven charts and flow diagrams
- Supports text, sketch, photo, PDF and CSV/Excel inputs
- Over 50 chart types and 4 diagram families with 500+ templates
- Editable outputs in layered SVG, 8K PNG/JPG and PPTX formats
- Color‑blind‑safe palettes and 60+ color schemes tailored for journals
- Free credit allotment for new users, credits do not expire
Details
- Pricing
- Freemium
- Category
- Research
Suggest an edit
Sign in to suggest an edit.
Pros and cons
Pros
- Handles multiple input modalities, letting you start from a sentence or a data file.
- Provides a wide range of chart types and diagram templates suited to many disciplines.
- Outputs are fully editable, allowing fine‑tuning of labels, colors and layers.
Cons
- Pricing information for paid plans is not disclosed on the site.
- The credit‑based model may require purchase for extensive use beyond the free allotment.
- No mention of integration with external design or analysis software.
Alternatives
 ScisummarySciSummary is an AI tool built to help people read and understand scientific and research papers.
 PublicviewPublicView is a research platform for public-company SEC filings.
 Copyowl AICopyOwl is an AI agent for deep research and writing.
 ArtblastaiArtBlast AI is a web platform for creating art with AI.
 Stable VideoAI video model transforming images/text into videos.
 Golinks Search Powered By ChatgptIf ai recruiting tasks are part of your routine, Golinks Search Powered By Chatgpt is worth testing against your own use cases. Their website, golinks.io, has the full details. The...
 Canva AICanva Magic Studio review (October 2026): Canva's AI design tools, Magic Write, Magic Edit, Magic Media, plans, AI usage limits, pros and cons.
 Tootoon GptGenerates sketch videos from one-sentence stories using ChatGPT and style transfer.
 AI Cartoon GeneratorAI Cartoon Generator is a web tool that creates cartoon, anime and manga-style images from text descriptions.
 Wan 3 AIWan 3 AI lets fitness coaches generate short movement illustrations with realistic motion to accompany workout plans and posts. Personal trainers and yoga teachers explain movement all day, but filming…
 Perplexity AIPerplexity review (October 2026): the AI answer engine's features, verified Pro, Max and Enterprise pricing, pros, cons and alternatives on AIMAPER.
 Study SimStudySim is an AI study workspace that builds study materials from your own course content.