


ai-stock-pool
AI industry-chain stock pool with US/A-share mapping, active discovery, policy pressure, and one-click deployment.
Sign in to rate this tool.
Overview
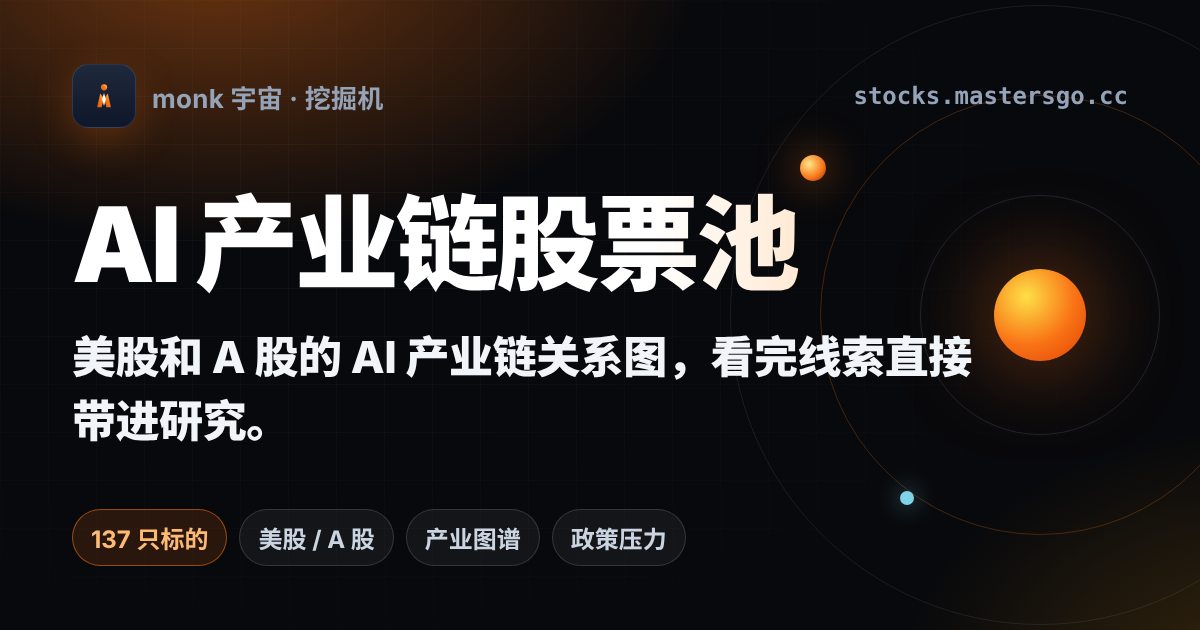
Ai‑stock‑pool is a free web platform that maps AI‑related companies across U.S. Equities and Chinese A‑share markets onto a single relationship diagram. The diagram shows each company's place in the supply chain, upstream, mid‑stream or downstream, along with signals from academic papers, market movement and policy pressure, so you can see how different parts of the AI ecosystem are linked.
When you open the site you first choose a market filter (U.S. Stocks, A‑shares, or both). You can then narrow the view by chain position, selecting only upstream firms, only downstream firms, or the full set. A second set of filters lets you focus on thematic groups such as HBM/storage, optical interconnect, power‑liquid cooling, advanced packaging or robotics. After applying filters, the tool draws a network graph where each node represents a listed company and each edge reflects a supply‑chain or thematic connection. The graph can be zoomed with the mouse wheel, panned by dragging, and reset by double‑clicking. Weak relationships can be hidden, which reduces visual clutter and highlights the strongest links.
The workflow is presented as three steps. First, the map surfaces clues, new candidates, paper‑derived signals, or companies under policy pressure. Second, you bring those clues into a research workspace (the “工作台”) where you may annotate the node, attach a note, or link to a related research report. Third, the platform records the association and returns the company to the pool for ongoing tracking, so you can monitor its performance over time. For each ticker the panel lists the company name, market, sector, current price, daily price change and a brief “core positioning” label. The “今日发现与数据健康” (today's discoveries and data health) section updates when new data are loaded, although the market feed is shown as “行情未连接”, meaning live price data are not streamed.
The tool is oriented toward analysts, investors or researchers who need a visual overview of the AI supply chain across two major markets and who want to combine that view with quick note‑taking and report linking. It is less useful for traders who require real‑time price feeds, because live market data are not integrated. Likewise, users looking for automated alerts or algorithmic screening will not find those capabilities here, as the site does not mention any alert system or programmable API.
Key features
Details
- Pricing
- Free
Suggest an edit
Sign in to suggest an edit.
Pros and cons
Pros
- Provides a unified visual map linking U.S. And Chinese AI‑related equities across the supply chain
- Supports multiple filters, letting you isolate specific chain positions or thematic groups
- Includes a built‑in workspace for notes and report linking, keeping research attached to the map
- Free to use, with no subscription required
Cons
- Live market data are not connected, so price information may be out of date
- No information on pricing or premium tiers, leaving advanced capabilities uncertain
- Policy‑pressure and active‑discovery data are listed as loading, indicating possible delays or incomplete coverage.
Alternatives
 Music Tomorrow ComMusic Tomorrow is a data platform for the music industry that focuses on how streaming algorithms affect discovery.
 EffieEffie is a writing app that combines a distraction-free editor, mind maps, outlines and an AI assistant in one place.
 Credo AICredo AI is an AI governance platform for enterprises.
 QodoQodo (formerly CodiumAI) reviews pull requests with multiple AI agents that learn your team's rules, check cross-repo impact and map your services.
 ConsensusConsensus searches peer-reviewed papers and writes cited answers, with a Consensus Meter that shows how the evidence splits on yes/no questions.
 Gowit Retail Media Ads PlatformGoWit is a commerce and retail media advertising platform.
 Workramp LmsLearn:Up is an AI-powered learning management system from Confirm, previously known as WorkRamp.
 Mindmap AI AppMindMap AI is an AI mind map generator that builds maps from your own content.
 Lakera GuardLakera is a security platform for generative AI.
 Gauthmath ComGauth, formerly known as Gauthmath, is an AI homework helper for students.
 PortfoliopilotPortfolioPilot is an AI-powered financial advice platform for self-directed investors.
 Imaginario AIImaginario AI is a video intelligence platform for marketing and post-production teams.